USING MAPS
Unit
Overview
Because
it is not always convenient to carry a globe, we usually rely on maps to find
places and to arrive at our destinations.
They can also help us o picture, understand, and report information. Modern geographic tools, such as satellite
images and GPS, assist cartographers in creating maps to meet a wide variety of
needs. In other words, maps do much more
than get us from place to place. Let’s
see how it all works!
Advantages
and Disadvantages of Maps
Globes
are the most accurate way to represent the Earth, but they are not the most
convenient. For instance, you cannot
fold a globe and carry it with you easily.
Globes are also limited in the amount of detail that they can
display. Think how large a globe would
have to be to show city streets and state routes. For these reasons, a cartographer often
creates a map, another geographic tool that shows where to locate places on the
Earth. A map is a drawing that presents a section of the Earth’s surface on
a flat sheet of paper. When compared to
globes, maps have some major advantages.
For one thing, they are very portable.
This means that they fit into your pocket, purse, or carry-on bag. At the same time, maps show important details
that are too small for globes to include.
They can help you to find your way around a few city blocks or farmland
on a rural, county road. In spite these advantages, maps have a major
disadvantage. This problem is called as distortion. The video listed below explains exactly how
and why this happens.
Distortion occurs when
cartographers try to show portion of the round Earth on a flat sheet of
paper. It is simply not possible to do
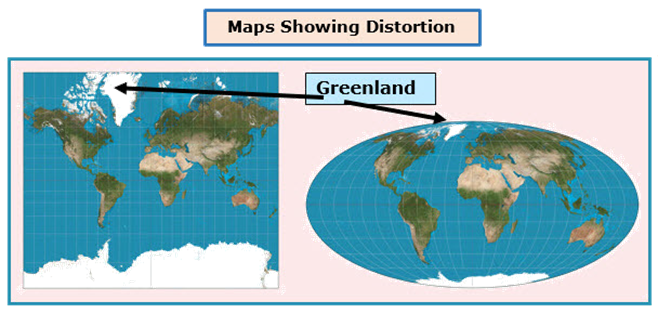
this with perfect accuracy. The size,
shape, and position of the regions on the map change when a cartographer
projects them onto a flat surface. For
example, a map that shows the correct, relative size of the continents distorts
their shapes. On the other hand, a map
that shows the correct shape of the continents distorts their size. Note the difference in the size and shape of
Greenland on the maps below.
Parts
of Maps
Because
people use them for many different reasons, cartographers ask themselves
several questions when they create maps.
What areas does the map need to display?
Who is going to use this map?
What information must this map provide?
At the same time, cartographers want to make their maps understandable
and user-friendly. With all of this in
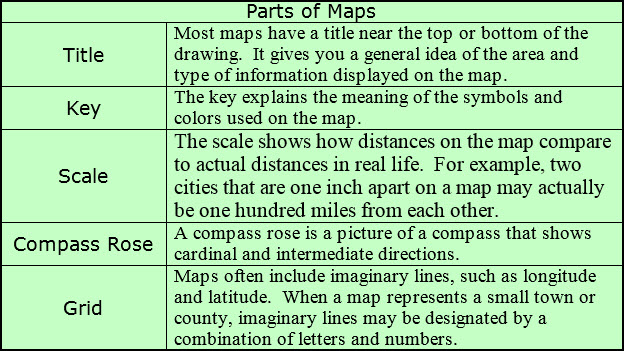
mind, they frequently add five important features to their maps: a title,
a key, a scale, a compass rose,
and a grid. The title indicates the regions that the map
covers and sometimes explains why the map is useful. The key, also called a legend, explains the
symbols and colors used by the cartographer.
For example, stars may designate capital cities, and the color blue may
identify bodies of water.
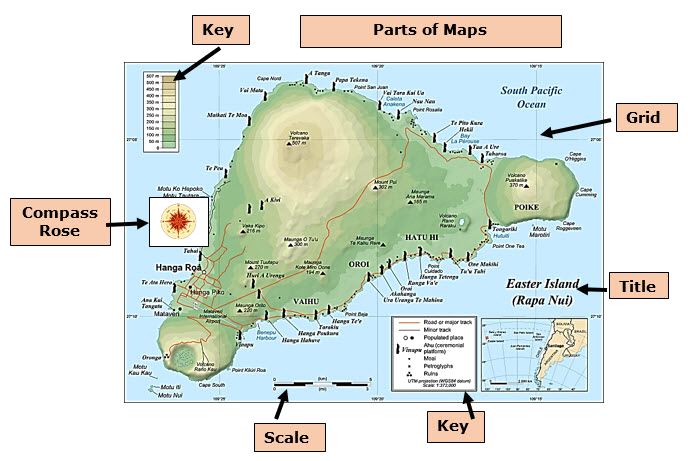
Because
they almost always make areas much smaller than their actual size,
cartographers include a scale with their maps.
This looks like a small ruler. A
scale shows the relationship between the distance on the map and the real
distance. For example, one inch may
equal one hundred miles. A compass rose
is the map’s direction indicator. It
shows cardinal directions (north,
east, south, and west) and intermediate
directions (northeast, southeast, southwest, and northwest). This enables
the person viewing the map to use relative
location to find specific places. Like globes, maps incorporate imaginary lines
to form grids. This helps the person who
is using the map to pinpoint absolute
locations. Maps that display large
areas show the lines of latitude and longitude.
For smaller areas, such as cities and counties, cartographers use grids
based on letters and numbers.
By
adding these parts, cartographers help users to interpret and to understand the
maps that they create. The video listed
below shows just how valuable these elements are.
Types
of Maps
Cartographers
create many different types of maps, but two of the most common are political
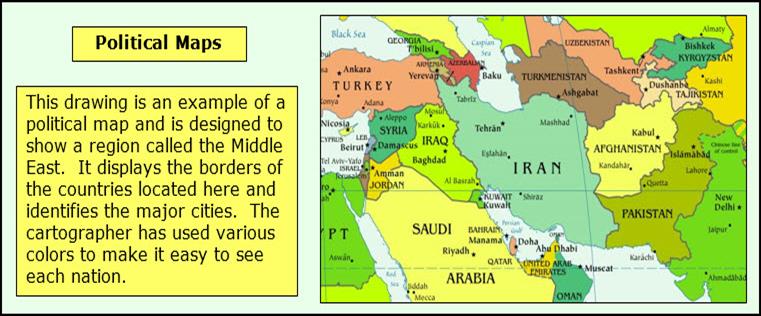
and physical maps. Political maps display countries, their borders, states and major
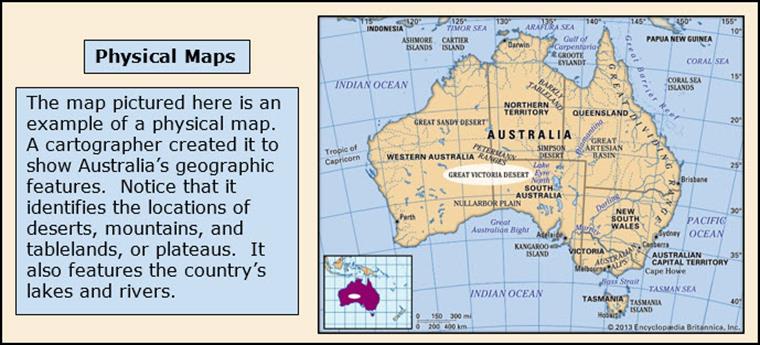
cities. Physical maps, on the other hand, focus on waterways and landforms,
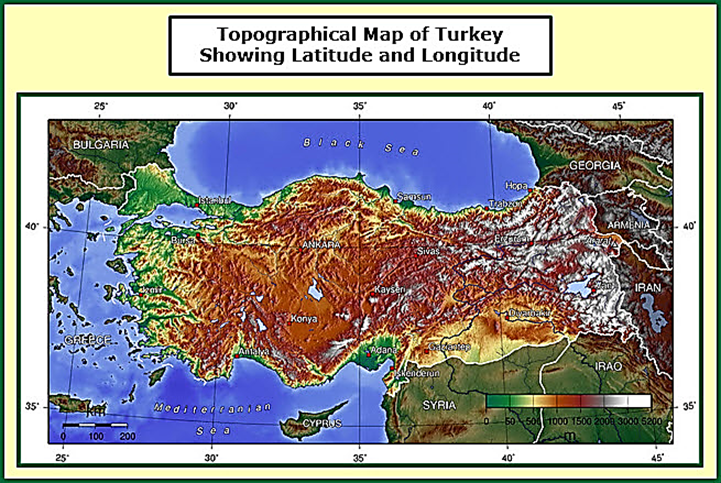
such as mountains, deserts, plains, and plateaus. Cartographers draw many kinds of physical
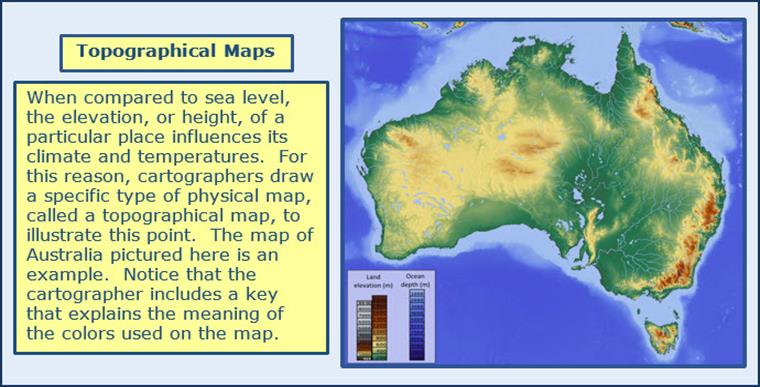
maps to display specific features. For
example, topographical maps show
variations in the heights above sea-level within a particular region.
Map courtesy of Hans Braxmeier
Cartographers
often create maps that provide specific information and emphasize a particular
topic, or theme. These drawings are
called thematic maps. When you watch the morning news, you are
likely to see a weather map. It shows
the weather conditions for your local area along with the rest of the
country. Do you need to carry an
umbrella? Do you need a jacket? Should you plan an outside activity for this
afternoon? This type of thematic map
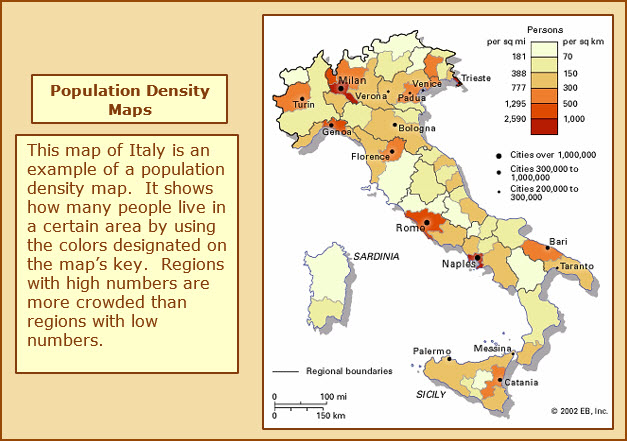
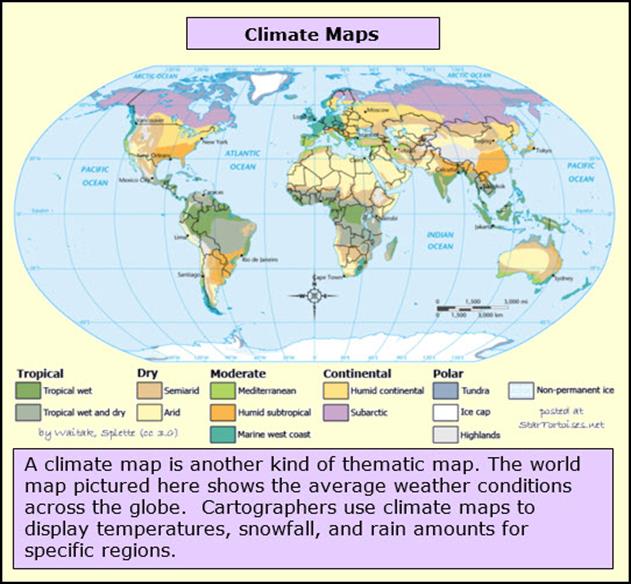
allows you to answer these questions quickly and easily. Cartographers design other thematic maps to
show population density, overall climate and the location of natural resources,
just to name a few. The old saying, “A
picture is worth a thousand words,” is certainly true when it comes to thematic
maps. Here are some examples.
Map courtesy of Waitak
Maps
and Coordinates
Like
globes, maps use the imaginary lines of latitude and longitude to create
coordinates that identify absolute locations.
Remember—lines of latitude run across the map horizontally, while lines
of longitude run up and down. We use
these lines to from coordinates that
help us find specific places. The first
half of the coordinate consists of the number of a line of latitude and an N or
S. On the map of Turkey pictured below,
all latitude lines will be followed by an N because Turkey is north of the
Equator. The second half of the
coordinate is made up of the number of a line of longitude followed by an E or
W. The lines of longitude displayed on
this map will be followed by an E because Turkey is located east of the Prime
Meridian. What island on this map is
located at 35°N 33°E? If you said
Cyprus, you are correct.
Map Courtesy of Wikimedia Commons: Captain Blood
Other Geographic
Tools
Geographers
study the land, features, and inhabitants of the Earth. Their work provides valuable information that
helps people understand and cope with the environments in which they live. You already know about maps and globes, two
common tools used by geographers. Today,
however, they also relay on a number of other sources. For example, aerial photographs and videos are pictures taken by cameras on
board airplanes, drones, and helicopters.
They provide many kinds of current and detailed information. For example, aerial photographs enable
geographers to pinpoint environmental changes.
They can also show us traffic patterns and alternative routes that are
less crowded. Watch the video listed
below to see a day in the life of an aerial photographer.
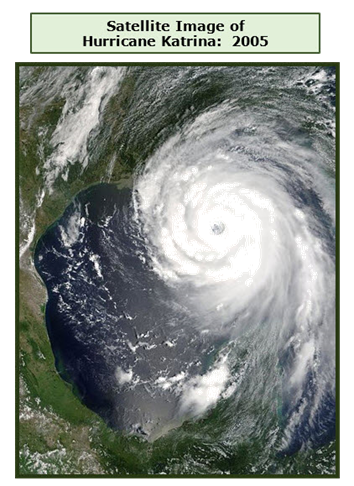
Satellite images are produced
digitally by computers operating on satellites.
Governments and private companies have invested in satellite imagery to
provide the public with a wide variety of useful information. For example, meteorologists track the path,
size, and strength of hurricanes with this technology.
The Global Positioning System (GPS) is a
network of over thirty satellites owned by the United States government and
operated by the United States Airforce.
It accurately pinpoints the exact position of something on Earth by
sending signals to smart phones and other receivers. Originally developed for military purposes,
today’s GPS has become part of our daily lives.
We rely on it to get from place to place, to track our deliveries, and
to harvest crops at the right time. As
the following video explains, GPS can be very helpful if you are looking for
pizza. Click on the graphic to see just
how it works.
A Geographic Information System is
another a useful geographic tool. Like
GPS, GIS captures and displays information, but it also has the capability to
analyze the data that it stores. This
enables the system to create maps and to connect data to them. By clicking on the map at a specific point,
the user can find additional information.
Imagine a major fire on a city block.
With access to GIS, workers can readily learn the location of power
lines, natural gas lines, and sewers.
GIS is also used to track wildlife as it migrates from one region to
another. Law enforcements relies on
these systems to identify areas that are likely to experience criminal
activity. Click on the graphic below to
watch a video that explains more about mapping with GIS.
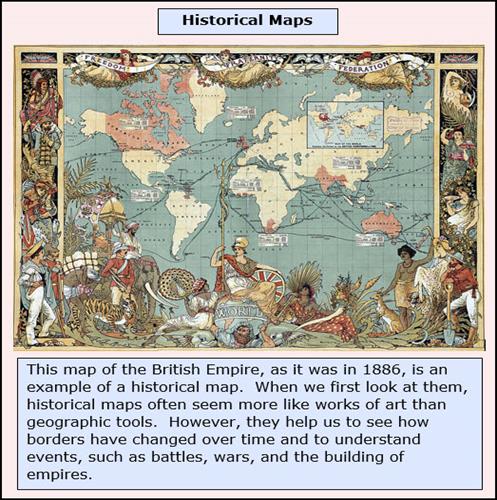
Although
modern technology provides geographers with a wide variety of current
information, historical maps, or maps from the past, are also valuable. They show changes over time and show us how
current locations looked centuries below.
The map pictured below is an example.
Time
for a Quick Review
Before
moving on to Unit 3, take a few minutes to review the terms found in Unit
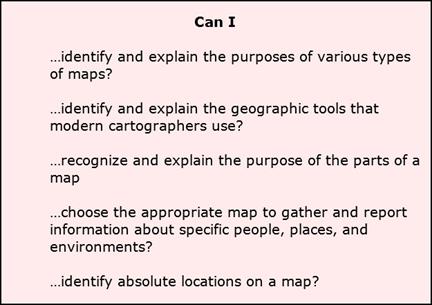
2. Be sure that you can answer the “Can
I” questions listed below with a loud “yes”.

Additional Activities and Resources
Unit 2 Map Skills