Throughout this course, we will study the Western Hemisphere (North and South America), its geographic features, early history, cultural development and economic change. Students will learn about the early inhabitants of the Americas and the impact of European exploration and colonization. The geographic focus includes the study of contemporary regional characteristics, the movement of people, products and ideas, and cultural diversity. Students will develop their understanding of the relationship between markets and available resources.
Geography is the study of Earth. It shows the relationship between the people and the environment. In this unit, we will focus on understanding that globes and other geographic tools can be used to gather, process and report information about people, places and environments. Cartographers, or people who draw and create maps, decide which information to include on maps.
Print the Five Themes of Geography Notes graphic organizer to take notes while reading and learning in the next section.
To understand the past and present of the United States, it is important to study geography and history. Geographers have developed five themes, or topics, to show the connection between geography and history.
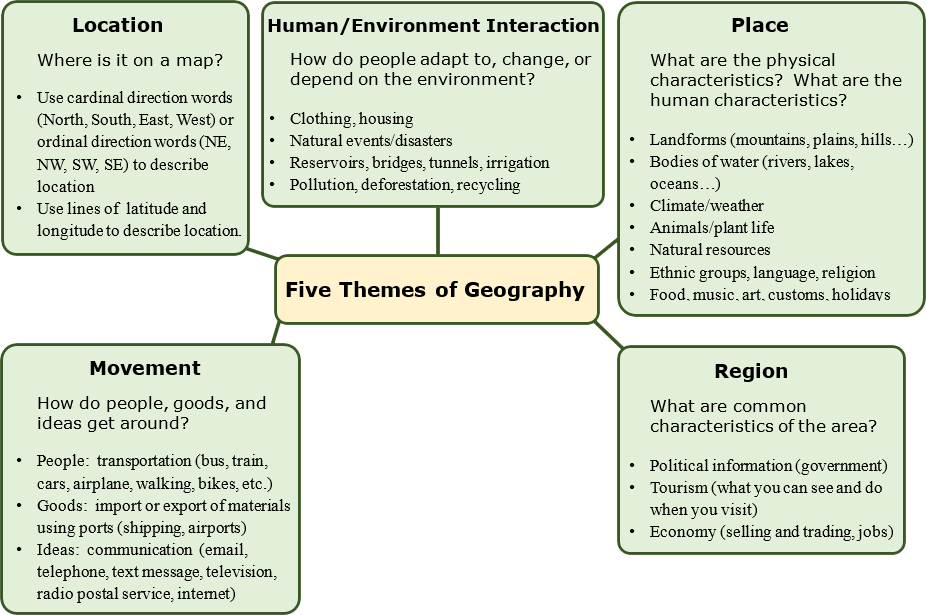
Where are things located? Geographers begin to study a place by finding where it is, or its location. A location can be specific (for example, it can be stated as coordinates of longitude and latitude or as a distance from another place) or general (for example, it can be stated using a cardinal direction, like S, or an ordinal direction, like NE). There are two types of location:
- Absolute location describes the place's exact position on the Earth.
- Relative location explains the relationship of a place to other places.
What makes a place different from other places? Place includes a location's physical and human features. Differences might be defined in terms of climate, physical features, or the people who live there and their traditions. The physical features of a place are described by explaining the natural environment, like "the climate is hot or cold" or "the land is flat or hilly." The human features of a place are described by explaining human ideas and actions, like how many people live there, what types of work they do, or what they do for fun.
How can Earth be divided into regions for study? A region can be defined by a number of characteristics that unify an area, including language, political divisions, religion, or vegetation. On maps, geographers use color, shape and/or special symbols to show regions.
What are the patterns of movement of people, products and information? A study of movement includes learning about transportation used by people (moving people), exports and imports (moving goods), and ways in which people communicate (moving ideas). People travel from place to place to get what they want and need. The first people who came to the Americas were hunters following animal herds. Much later, people came to the United States in search for freedom. When people move, they meet new people. They exchange goods and ideas. The movement of goods and people links the United States with all parts of the world.
What are the relationships among people and places? How have people changed the environment to better suit their needs? People interact with their environment. They build ditches to bring water to the desert so they can grow crops. They cut down trees. The changes people create in their environment bring benefits. However, changes can also cause problems, such as pollution.
We will be looking at items you may
find on a map and reasons you may use a map. Some of the topics covered will be what a compass rose is and why we use it, legends, scales and diagrams. Have you ever looked at a map and wondered what all those little symbols were? By using what is called the map scale or legend, you can find out. You might ask, how far is it from Columbus, Ohio to Cleveland, Ohio? To answer this question, we would use a map scale.
Maps are made for many reasons and vary in their content. Maps can be made for general purposes such as showing roads, rivers, cities, states, capitals, landforms, and even past events. All maps, however, contain a compass rose and a map key or legend. Globes are very similar to maps. A globe, or three-dimensional scale model of Earth, is tilted like the Earth and possesses a compass rose that points out cardinal directions, as well as lines of latitude and longitude that divide the globe into a grid. Maps are two-dimensional, or flat representations, of Earth. Although globes are more accurate, maps are easier to use.
Let's Practice! Print and complete The Globe.
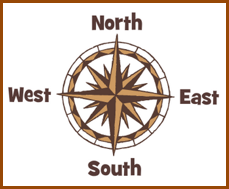 A compass rose is a small
drawing on the map that will help you find directions. Directions describe the way you face or move to
get somewhere. North, south, east, and west are the main directions or cardinal
directions. Look at the compass rose to the left. The cardinal directions are
written N, S, E, and W. The spikes in between the cardinal
directions on the compass rose are the intermediate directions. The ordinal directions are northeast (NE), northwest (NW),
southeast (SE), and southwest (SW). A compass rose is usually
found in the corner of a map and every map usually has one.
A compass rose is a small
drawing on the map that will help you find directions. Directions describe the way you face or move to
get somewhere. North, south, east, and west are the main directions or cardinal
directions. Look at the compass rose to the left. The cardinal directions are
written N, S, E, and W. The spikes in between the cardinal
directions on the compass rose are the intermediate directions. The ordinal directions are northeast (NE), northwest (NW),
southeast (SE), and southwest (SW). A compass rose is usually
found in the corner of a map and every map usually has one.
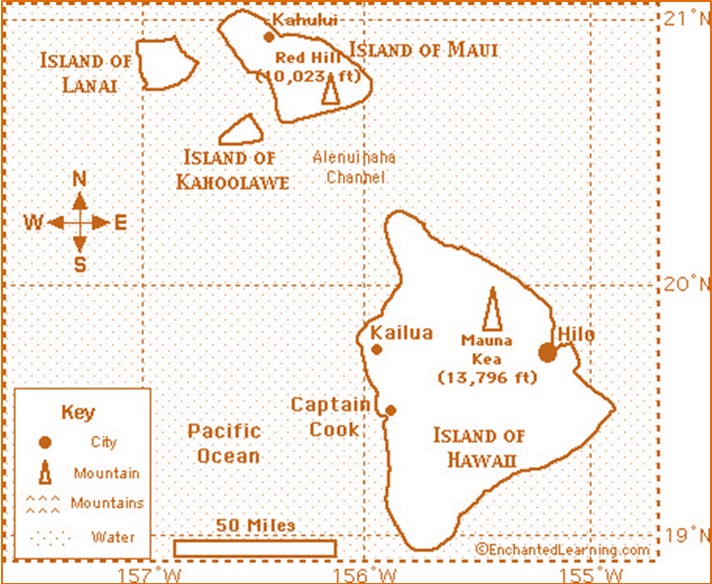
Using the compass rose and map above, which direction is Red Hill from Captain Cook? (North) Which direction is the Pacific Ocean from the Island of Hawaii? (West) If I am on the Island of Lanai, which direction would I go to land on the Island of Hawaii? (Southeast)
Let's practice! Print and complete the following activities!
Absolute and Relative Location Sort
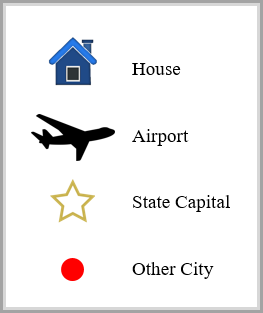
Another common feature found on maps is the map key or map legend. A map key or legend is a little box found in the corner of the map that contains symbols. A symbol is something that stands for something else. Some common symbols found in keys or legends are dots, lines, triangles, stars, and colors. Some symbols can also be small drawings of the things they stand for. For example, in the box below, the airplane stands for local airports. This box contains some other symbols you may find in a map key. What symbol stands for a city? If you said the red dot, you are correct.
All maps are smaller than the real area that they show. To figure out the real distance between places, most maps have a scale. A scale shows the relationship between the distance shown on a map and the real distance on Earth. Most map scales have two lines. The top line shows distance in miles. The bottom line shows distance in kilometers.
You can use a ruler to measure distances on a map. You can also use a strip of paper. To measure distance on the map below, we are going to make our own scale strip. Take a piece of paper with a straight edge. Place the paper below the scale on the map below and mark the distances (600 km and 600 mi). Move the paper along and continue marking the distances. Your scale should look similar to this:

Suppose you wanted to measure the distance from Chicago to Houston. You might make a guess by looking at the map scale, but we are going to use our scale strip that we just made.
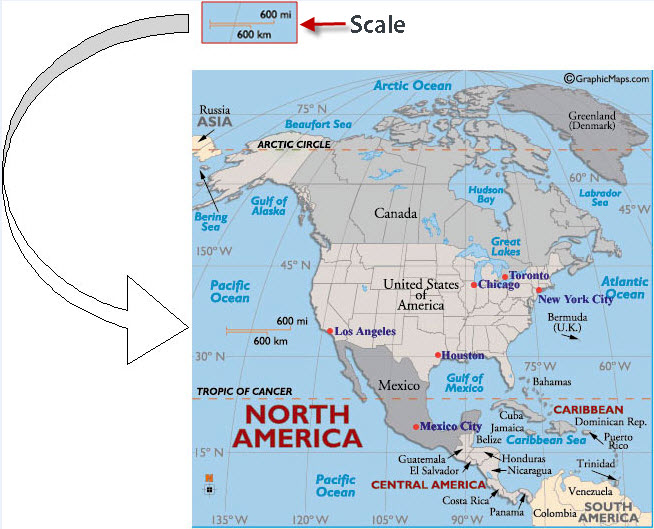
Place the edge of your paper scale strip between the dot for Chicago and the dot for Houston. Make sure the beginning of your scale is directly below the dot by Chicago.
Read the numbers beneath the dot by Houston on your paper strip scale. You can see that the distance between Chicago and Houston is about 900 miles or 1200 kilometers.
For a little extra practice, let's do one more. Place the edge of your paper scale strip between the dot for Los Angeles and the dot for New York City. Make sure the zero is directly below the dot by Los Angeles. Now read the numbers under the dot by New York City. We can see that the distance between Los Angeles and New York City is about 2,000 miles.
Let's practice! Print and complete Using A Map Scale.
Maps can show you many different things, like distances, regions, and countries. We used the above map to find the distance between two cities. We can discover the region by reading the title: North America. Taking a closer look at this map, we find that this map also shows us the three countries that make up North America. They are Canada, the United States, and Mexico. Greenland, the world's largest island, is also located in North America.
The map also shows us the major oceans that are in North America. They are the Pacific Ocean, the Atlantic Ocean, and the Arctic Ocean. Looking even more closely at the map, we can also see that Canada divides its country similarly to the way the United States divides its country. We call our divisions states, while Canada calls its divisions provinces.
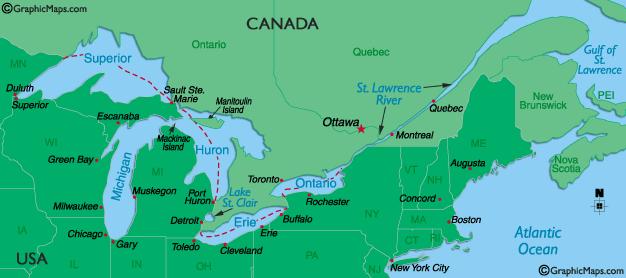
Now that we understand some of the special features that maps have, lets see if we can look at some maps and read and understand them. Look at the map below. What is the title of this map? If you said Canada, you are correct. Does this map have a compass rose? Yes, it is in the lower left corner. It looks a little different than what we have seen, but it is still there. Most maps show water in the shade of blue. This map shows us several different forms of water. First, we see to the East, the Atlantic Ocean and to the Northeast, the Gulf of St. Lawrence. We also see the St. Lawrence River which leads into the five Great Lakes. Can you name them? If you said Lakes Superior, Michigan, Huron, Erie and Ontario, you are correct. Although there is no map key on this map, you should remember that the little red dot stands for cities and the star stands for capital city.
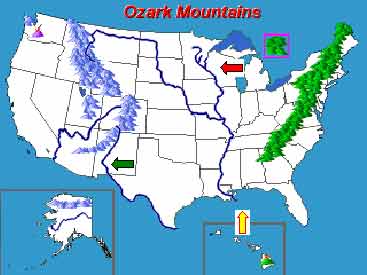
Now, lets look at the map below. What does this map show us? First, it shows us two mountain ranges. Do you know the name given to the range shown in the blue color? The correct answer is the Rocky Mountains. The Rocky Mountains are located in the western portion of the United States. This map also shows us another mountain range located in the northeastern part of the United States. The name of this mountain range is the Appalachian Mountains. The symbols used for these mountains are sort of a triangle ∆. Different colors are used to distinguish between the different mountain ranges.
Secondly, this map shows us the flow of several major rivers. The major river coming from the Great Lakes is the Mississippi River. (Look at the red arrow.) It flows south to the Gulf of Mexico. (Look at the yellow arrow.) The river that flows out of the Rocky Mountains and along the west side of Texas is called the Rio Grande River. (Look at the green arrow.) These rivers are shown by blue lines.
Let's Practice! Print and complete Map Elements.
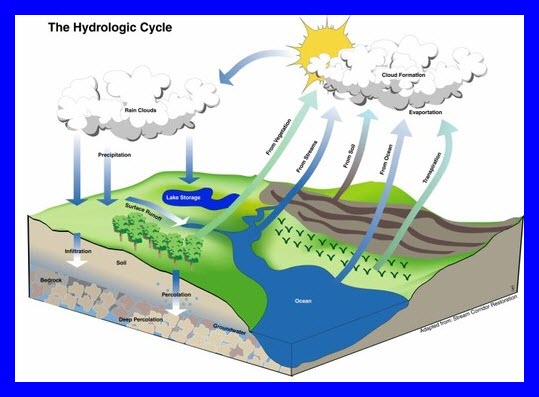
Geographical diagrams are illustrations or photographs in which specific, individual parts are labeled. By using and studying diagrams, we can further understand the geographic process involved.
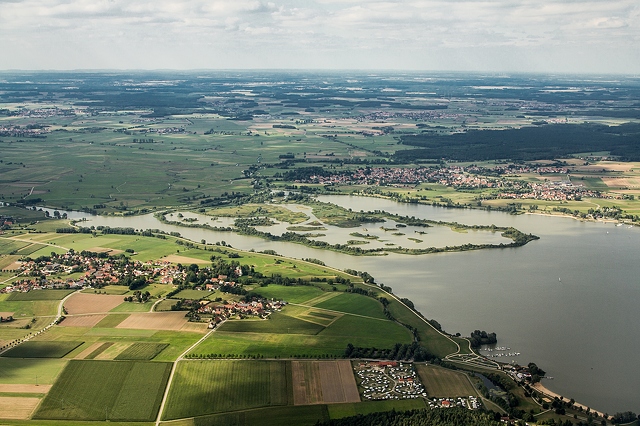
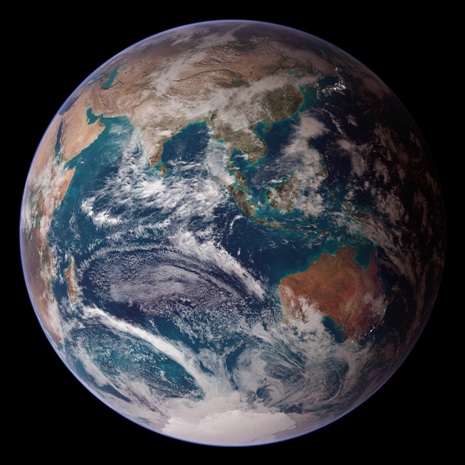
Aerial photography is the taking of photographs of the ground from an elevated/direct-down position. Aerial photographs were the first type of remote sensing utilized by cartographers, or map makers. In 1858, French map makers used a hot air balloon and primitive cameras to take the first aerial photographs. Later during World War I, airplanes were used to systematically take aerial images of much of the terrain in the war zone. By comparing photographs taken at different angles, cartographers can create accurate and detailed maps of different territories. The process of comparing different aerial photographs and determining accurate measurements is called photogrammetry. Maps created by using aerial photographs are called orthophoto maps.
Let's Practice! Print and complete Aerial Photographs Map Practice.
We have covered a lot of information about geography and geographical tools. We discovered the five themes of geography and how to use geographical tools to study geography. We learned that globes and other geographic tools can be used to gather, process and report information about people, places and environments. We also learned that cartographers, or people who draw and create maps, decide which information to include in maps.
Let's Explore! Google Earth lets you fly anywhere on Earth to view satellite imagery, maps, terrain, 3D buildings, from galaxies in outer space to the canyons of the ocean. Click on the image below to download the app and begin exploring with Google Earth!
BC, AD, BCE, and CE
When viewing timelines that describe events that happened long ago, we need to use additional terms to distinguish whether we are referring to the years before or after what we call year 1.
Vocabulary:
BC - an abbreviation for “before Christ” (used in indicating dates). The abbreviation BC “before Christ” is always placed after a date or century: Cleopatra lived from 69 to 30 BC The war took place in the first century BC.
BCE - an abbreviation for “Before (the) Common Era”. A secular or non-religious alternative to BC.
AD - an abbreviation for “Anno Domini” which is Latin for “In the year of the Lord”; since Christ was born. AD is placed before rather than after a date: Charlemagne was born in AD 742.
CE - an abbreviation for "Common Era" and a secular or non-religious alternative to AD.
You will see BC and AD sometimes spelled with periods (B.C. or A.D.) and sometimes without.

Below are additional educational resources and activities for this unit.