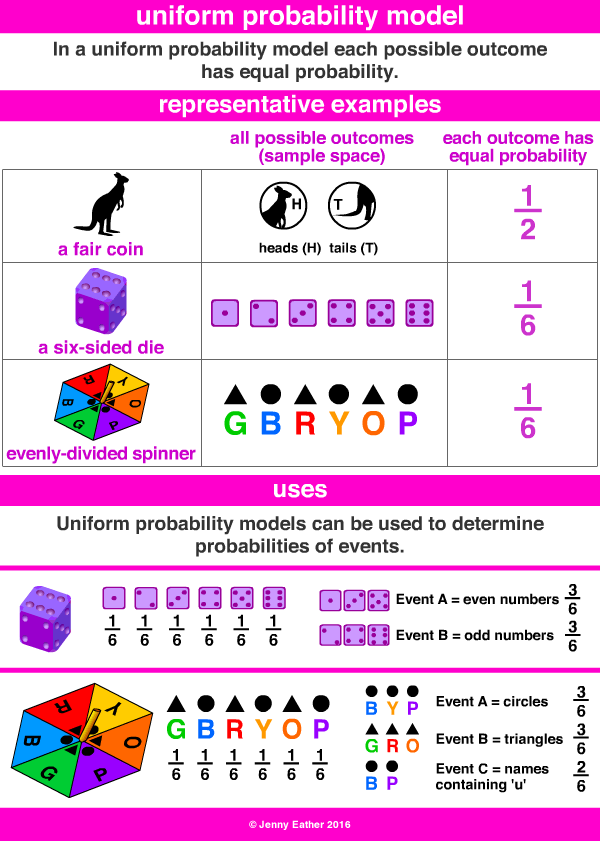
PROBABILITY MODELS
|
Unit Overview
In this unit, you will examine and construct uniform probability models. You will also make further explorations into theoretical and experimental probabilities looking at outcomes, events, and sample spaces.
A probability model is a mathematical representation of a chance occurrence. A model consists of:
An action is a process with an uncertain result.
Example: Rolling a number cube is an action with an uncertain result.
An outcome is a possible result of an action.
Example: One possible result of rolling a standard number cube is rolling a 3.
An event is one (or more) outcomes of an experiment.
Example: Tossing a coin that lands on “heads”.
A sample space is the set of all possible outcomes for the action.
Example: The sample space for rolling a standard number cube is 1, 2, 3, 4, 5, 6.
CONSTRUCTING A PROBABILITY MODEL
Example 1: Construct a probability model for rolling a single, fair die. The event is the number shown on the die.
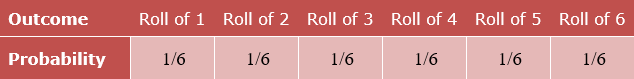
Solution: Begin by making a list of all possible outcomes for the experiment. The possible outcomes are the numbers that can be rolled: 1, 2, 3, 4, 5, and 6. There are six possible outcomes that make up the sample space.
Assign probabilities to each outcome in the sample space by determining the ratio of the outcome to the number of possible outcomes. There is one of each of the six numbers on the cube, and there is no reason to think that any particular face is more likely to show up than any other one. So, the probability of rolling any number is 1/6.
 |
Computing Probabilities of Equally Likely Outcomes
Let S represent a sample space for an experiment. When investigating probability, an event is any subset of S. When the outcomes of an experiment are all equally likely, we can find the probability of an event by dividing the number of outcomes in the event by the total number of outcomes in S.
Example 1: Suppose a number cube is rolled, and we are to find the probability of the event “rolling a number less than or equal to 4.”
Solution:
There are 4 possible outcomes of the event (rolling a 1, 2, 3, or 4).
There are 6 possible outcomes in the sample space (1, 2, 3, 4, 5, or 6).
Therefore, the probability of rolling a number less than or equal to four is 4/6 = 2/3.
Computing the Probability of an Event with Equally Likely Outcomes
The probability of an event, or (E), in an experiment with a sample space (S) and equally likely outcomes is given by:
![]()
![]()
E is a subset of S. Therefore, the probability of an event can be written as a fraction or decimal that is greater than zero, but less than 1. This can be expressed as 0 < P(E) < 1. Sometimes percents are used to represent the fractions or decimals.
Example 1: A number cube is rolled. Find the probability of rolling an odd number.
The event, “rolling an odd number,” contains three outcomes (1, 3, or 5).
There are 6 equally likely outcomes in the sample space (1, 2, 3, 4, 5, and 6).
Divide to find the probability of the event.
P(E) = 3/6 = 1/2
Therefore, the probability of rolling an odd number is 1/2.
 |
Let’s take a look at several examples of probabilities based on a uniform probability model.
Example 2: Gina has a bag of 12 marbles. The bag contains half black marbles and half white marbles. If Gina picks out two random marbles that are both white, what is the chance, in percent, that the next marble she picks will also be white?
Explanation: We know that there are 12 marbles in Gina’s bag. Half of them are black, and half of them are white. There are 6 black marbles and 6 white marbles. However, because she already picked out 2 white marbles, there are now only 4 out of 10 white marbles left.
P(E) = 4/10 = 0.4 = 40%
Gina has a 40% chance that the next marble she picks will be white.
Example 3: Billy's mom baked a pizza with eight slices. Half the slices have pepperoni only. Two of the slices have both pepperoni and onions. One slice has onions only. One slice has only cheese. If Billy takes a slice of pizza with his eyes blindfolded, what is the percentage chance that he will select a piece of pizza that does not have pepperoni on it?
Explanation: Let’s examine the pizza choices more closely.
4 slices had pepperoni (1/2 of 8 = 4)
2 slices had pepperoni and onions
1 slice had onion only
1 slice had only cheese
Out of 8 pieces of pizza, there are only 2 pieces that don’t have pepperoni on them.
P(E) = 2/8 = 0.25 = 25%
Billy has a 25% chance that he will select a pizza that does not have pepperoni on it.
Develop A Uniform Probability Model by Observing Frequencies in Data Generated from A Chance Process
Example 1: Kelly is going to spin the spinner pictured below, 50 times. What is the theoretical probability of the spinner landing on the pink section?
 |
Explanation: The theoretical probability is what should happen. In this case, we have 6 spaces, and 1 of those spaces is pink. Thus, the theoretical probability of the spinner landing on pink should be 1/6.
Example 2: Kelly spun a spinner, which is pictured below, 50 times. She recorded her results in the table provided. What is the experimental probability of the spinner landing on the pink section?
 |
Explanation: The experimental probability is what actually happened in the experiment. In this case, Kelly spun the spinner 50 times, and she landed on pink 13 times. Thus, the experimental probability is 13 out of 50 = 13/50.
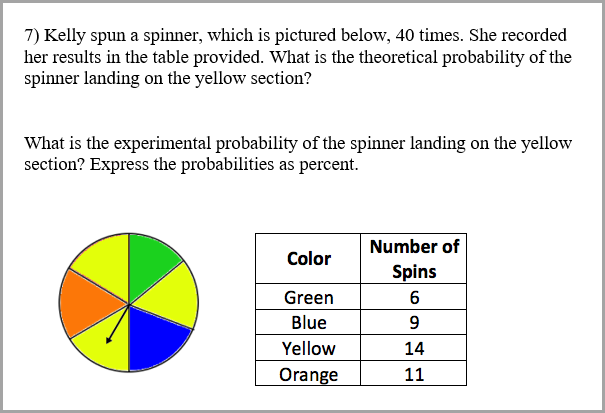
Example 3: Kelly spun a spinner, which is pictured below, 35 times. She recorded her results in the table provided. Compare the theoretical probability of the spinner landing on the orange section and the experimental probability of the spinner landing on the orange section?
 |
Explanation: The theoretical probability is what should happen. In this case, we have 6 spaces, and 1 of those spaces are orange. Thus, the theoretical probability of the spinner landing on orange would be 2/6 or 1/3 or 0.33 (rounded to the nearest hundredth).
The experimental probability is what actually happened in the experiment. In this case, Kelly spun the spinner 35 times, and she landed on orange 13 times. Thus, the experimental probability is 13 out of 35 = 13/35 or 0.37 (rounded to the nearest hundredth).
In this experiment, of spinning the spinner 35 times, the experiment probability (0.37) was slightly higher than the theoretical probability (0.33) for the spinner landing on an orange section.
Let’s Practice.
|
|
|
|
|
|
|