In this unit, you will be working with bar graphs. A bar graph makes the things that you are comparing much easier to see by just looking at the length of the bars. You will also continue learning about pictographs.
Bar Graph
A Bar Graph is a graphical display of data using bars of different heights.
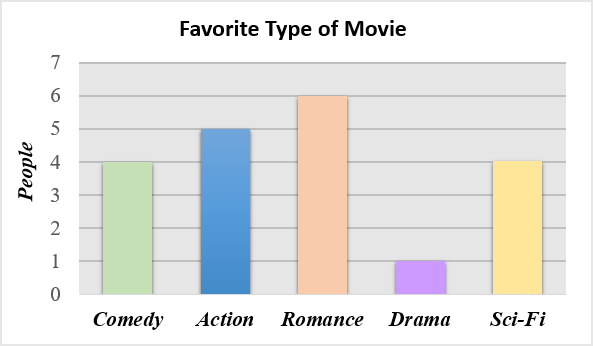
Imagine you just did a survey of your friends to find which kind of movie they liked best:
We can show that on a bar graph like this:
It is a really good way to show relative sizes: we can see which types of movie are most liked, and which are least liked, at a glance.
We can use bar graphs to show the relative sizes of many things, such as what type of car people have, how many customers a shop has on different days and so on.
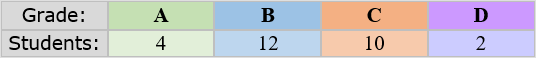
Here is another example.
In a recent test, this many students got these grades:
A Pictograph is a way of showing data using pictures or symbols on the graph. Each picture or symbol stands for a certain number of things. The key shows how many each picture or symbol stands for.
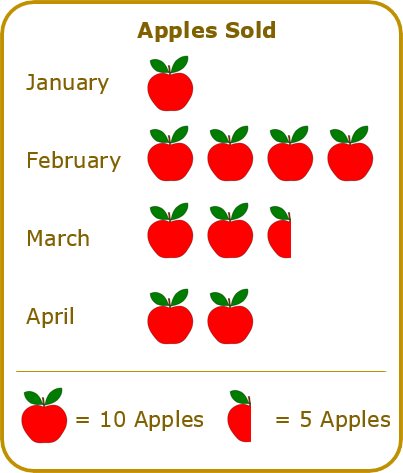
Here's an example: Apples Sold
Here is a pictograph of how many apples were sold at the local shop over 4 months:
Note that each picture of an apple means 10 apples (and the half-apple picture means 5 apples).
So the pictograph is showing:
In January, 10 apples were sold.
In February, 40 apples were sold.
In March, 25 apples were sold.
In April, 20 apples were sold.
Click on the link to watch the video "Interpreting picture graphs (paint)" or click on the video to learn how to solve a multi-step word problem involving a picture graph.