DEMAND: THE CONSUMER RULES
The Law of Demand Pictured on a Demand Curve
Unit
Overview
If
someone asked you to define the word demand,
you would probably say that it is the desire to have a particular item. To an economist, however, demand is something
more. Yes, it is the desire for a
particular product, but it is also the ability and willingness to pay for that
product. How does this affect the
decisions of what, how and for whom to produce?
What is the relationship between the price an individual is willing to
pay and the quantity in demand? What
changes affect the demand curve, and how do they impact consumers? You will find the answers to these questions
in this unit so let’s get started.
How an
Economist Defines Demand
The
study of economics is divided into two major categories—microeconomics and macroeconomics. The two terms are based on the Greek prefixes
micro, meaning small, and macro, meaning large.
Macroeconomics examines the big picture by focusing on the behavior and
decision-making of entire economies. On
the other hand, microeconomics analyzes the behavior and decision-making of
smaller units, such as individuals, families, households and businesses.
One
important topic covered under microeconomics is the concept of demand. Generally, people think of demand as the
desire to own a particular item. For an
economist, however, desire is just one of the factors that creates a demand for something. Consumers must not only want a product but
must also have the ability and willingness to pay for that product. In the market system, buyers demand goods,
and sellers supply them. This
interaction between the two groups leads to agreement on the price and the
quantity that is produced.
 Go to Questions 1
and 2.
Go to Questions 1
and 2.
The
Law of Demand
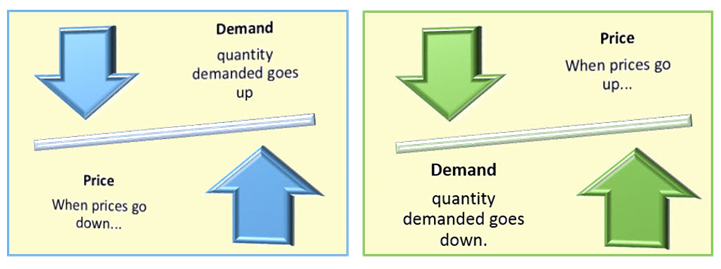
The law of demand simply puts into words
something that every consumer knows to be true.
It states that consumers buy more of a good when its price decreases and
less of a good when its price increases.
In other words, when the price of a certain product is high, consumers
will buy less; when the price is low, consumers will buy more. All of us recognize this on a daily basis
when we make purchasing decisions. For
example, would you buy a doughnut for breakfast if it cost $1? In fact, at that price, you might even buy
two or three. Would you buy that same
doughnut if it cost $2? It is likely
that fewer people would purchase a doughnut at this price. Even a true doughnut lover would probably
purchase one or two rather than three or four under this condition. As the price of a doughnut goes higher and
higher, fewer and fewer people will agree to buy it.
 Go to Questions 3
and 4.
Go to Questions 3
and 4.
Human
Behavior and Demand
The
law of demand is the result of three patterns of human behavior. The substitution
effect, the income effect, and
the principle of diminishing marginal
utility describe different reactions that encourage consumers to change
their spending habits. They also explain
why price increases or decreases influence the number of goods that are
purchased. When the price of a doughnut
goes up, doughnuts become more expensive than other options, such as breakfast
sandwiches or bagels. This causes a drop
in the number of doughnuts demanded by buyers.
A consumer could eat breakfast sandwiches three days a week and could
decide to purchase doughnuts only two days per week. This change
in spending habits is due to the substitution effect. Consumers react to an increase in prices by
purchasing less of one good and more of another. The substitution effect also occurs as a
result of a drop in prices. When the
price of doughnuts goes down, consumers will buy more, and the demand for
doughnuts will increase. They will be less likely to purchase other breakfast
items as substitutes.

Televisions: Name Brands or Lesser-Known Brands?
A
change in prices impacts our feelings and emotions. If costs increase, we feel poorer. When our limited budgets no longer cover as
many concert tickets, clothes or doughnuts as they once did, we feel as if we
have less money and cut back on some items.
The income effect occurs when we buy fewer doughnuts without increasing
our purchase of other foods. Of course,
the income effect operates in reverse when prices decrease. We feel wealthier when prices are lower. This leads to greater spending and increased
demand. It is also the basis for the
law of demand—when a good’s price is lower, people buy more of it; when a
good’s price is higher, people buy less of it.
As
you know, economists apply the word utility to describe the usefulness
or satisfaction that a person receives from a particular good or service. It is, after all, the reason that we purchase
something in the first place. However,
do we get the same amount of satisfaction when we buy more than one of the same
item? The answer to this question is
based on the economic principle of diminishing marginal utility. Consumers derive the most satisfaction from
their first purchase of a particular product and less if they buy the same
product a second time. Utility continues
to decrease, or diminish, with each additional purchase of the same good. For example, when you buy a newspaper, why do
you not buy more than one copy of the same publication? Buyers gain little or no satisfaction from
reading the same stories again.
Therefore, additional purchases of the same newspaper are subject to
diminishing marginal utility.
 Go to Questions 5
through 7.
Go to Questions 5
through 7.
Illustrating
the Law of Demand
Mark
is chairperson of the student council’s fund-raising committee at his
school. The committee has decided to
raise money by selling doughnuts before classes every morning for a few
weeks. The members have decided on the
type of doughnut to sell but are debating how much to charge per doughnut. They conduct a poll to see what prices
students would be willing to pay for this item.
To analyze this information, however, Mark and his committee need to
think like economists.
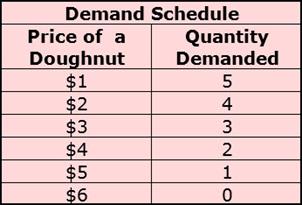
A demand schedule is a tool used by
economists to organize data. It lists in
a table the quantity of a good that people will buy at each price in the market. The table below shows the numbers of
doughnuts that students are willing and able to purchase at specific prices.
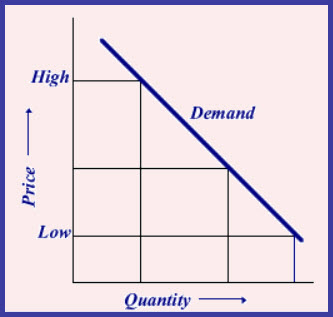
The
committee could also study the figures on this demand schedule by plotting them
on a graph known as a demand curve. It pictures the quantity demanded at each and
every price that might be present in the market. When an economist transfers the numbers from
a demand schedule to a graph, he or she always marks the vertical axis with the lowest possible price at the bottom and the
highest one at the top. The horizontal axis shows the lowest
possible quantity demanded on the left and the highest on the right. Each pair of price and quantity-demanded
numbers from the schedule are plotted on the graph. The demand curve emerges when the economist
connects the points.

Notice
that the demand curve slopes downward to
the right. As the price decreases,
the quantity demanded increases. This
means that a demand curve is just another way of stating the law of demand, which
emphasizes that higher prices will always result in less demand. All demand schedules and curves support the
law of demand. However, demand schedules
and demand curves have limitations. They
both assume that other factors, which could affect demand, remain the
same. In the case of doughnuts, the
quality, size and ingredients could affect the students’ demand for the
product. In other words, demand
schedules and curves are only accurate as long as there are no changes other
than price. Economists refer to this
assumption as ceteris paribus, a Latin phrase meaning all other things remaining the same or constant. When price is the only thing that changes, we
move along the same demand curve to a different quantity demanded. The curve itself, however, does not move.
 Go to Questions 8
through 13.
Go to Questions 8
through 13.
Why
Demand Shifts
As
you have already discovered, economists often define words or phrases
differently than the average person would expect. This is especially true of the terms demand
and quantity demanded.
Economists define demand as a consumer’s desire, willingness and ability
to purchase something. Demand is created
when the buyer wants the product and is able to afford it. In contrast, quantity demanded represents the
exact amount, or quantity, of a good or service that the consumer is willing to
buy at a specific price.

Changes
in quantity demanded are due to price, and all other things remain constant (ceteris paribus). Increases or decreases in demand, however,
result from changes in a number of other factors, such as consumer income,
consumer taste, population, expectations and related goods or services. Economists
call these influences determinants. When consumers are willing to buy different amounts of the product at the same
prices, the demand curve itself shifts to the right if demand increases or
to the left if demand decreases.
Ø Consumer Income: A
change in consumer income is one determinant that can affect demand. If incomes increase, buyers purchase more
products and choose higher-priced goods and services. Items purchased under these conditions are
called normal goods. A decrease in incomes, however, results in a
decrease in demand. In this situation,
consumers are more likely to buy inferior
goods, a term economists use to refer to products that people would
probably not buy if their incomes were higher.
For example, if a consumer experiences a decline in income, he or she
may choose to buy a used car (classified as an inferior good) rather than a new
car (a normal good).
Ø Consumer Taste: Consumers
do not always want the same things. For
this reason, changes in taste and preference also affect demand. A different season, a new fashion trend, an
advertising campaign, new information and updated technology can influence
demand for a particular item or service.
People will often stand in long lines for hours to be the first to buy
the latest smart phone or athletic shoe.
When consumers want more of a product, they buy more of it at each and
every price available in the market.
This shifts the entire demand curve to the right. On the other hand, people may also grow tired
of a particular good and demand less of it at each price point. This moves the entire demand curve to the
left. Toys are a good example. Certain ones may be very much in demand
during one Christmas season but totally out of fashion by the next one.

Winter Weather Increases the Demand for Snowboards and
Decreases the Demand for Swimwear.
Ø Changes in Population: When the size of the population changes,
demand for most products changes, too. More
people must be sheltered, clothed and fed when the population increases. For example, American soldiers married and
started families in record numbers when they returned from World War II. This resulted in a jump in the birthrate,
known as the baby boom, from 1945
through 1964. Towns had to build new
schools to accommodate the growing number of children. When these same children entered college,
universities had to build more dormitories and classrooms. Today, the baby boomers are retirees, and the
market is adjusting to their demands for the services desired by senior
citizens.
Ø Changes in Expectation: The way in which individuals envision the
future or anticipate the outcome of certain events is another determinant that
influences demand. If consumers expect
that the price of a particular good or services is about to increase, demand
rises because buyers purchase more before the price goes up. When consumers expect the price of a good or
service to decrease in the near future, demand temporarily decreases because
buyers delay their purchases until the price drops. For example, let’s say that you are in the
market for a new pair of running shoes.
The salesperson suggests that you purchase them today because the store
plans to increase its prices next week.
Because you expect a higher price in the future, you and other customers
increase the demand for the shoes today.
If, on the other hand, the salesperson mentions that the same shoes are
going on sale next week, it is likely that you would postpone your
purchase. Because you expect a lower
price in the future, you and your fellow buyers decrease the demand for the
shoes today.
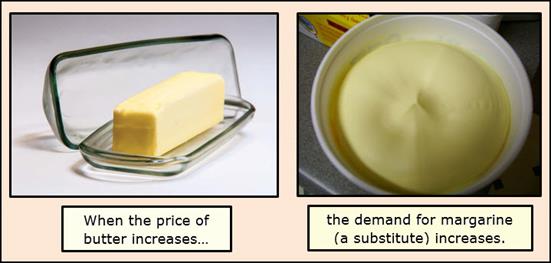
Ø Changes in Related Products: Changes in related goods or services also
impact demand. Economists divide related
goods into two categories: substitutes and complements. Substitutes are
products that can be used to take the place of others. The purchase of generic canned vegetables as
opposed to name-brand canned vegetables is one example. For the most part, the demand for name-brand
canned goods increases when the price of the generic version, or substitute,
goes up. For a minimal or no-price
difference, consumers frequently opt for the name brands and increase the
demand for them. On the other hand, the
demand for the brand-name product decreases when the price of the generic, canned
vegetables decreases. This occurs
because a significantly lower price often inspires shoppers to select generic
substitutes. In this situation, name
brands experience a decrease in demand.
Complements, such as computers and computer software, refer to products
that are purchased and used together. If
computer prices decrease, consumers demand more computers and more
software. If the price increases, buyers
demand fewer computers and, in turn, less software.
 Go to Questions 14
through 22.
Go to Questions 14
through 22.
What’s
next?
The
market system emphasizes the consumers’ ability to buy what they want and can afford. At the same time, it stresses that sellers
make enough profit to stay in business.
In the next unit, you will learn about the supply side of the market. How do economists define supply? Is there a law of supply that counterbalances
the law of demand? Are you a
supplier? Before moving on to find the
answers to these and other questions concerning supply, review the names and
terms found in this unit; then, complete Questions 23 through 32.
 Go to Questions 23
through 32.
Go to Questions 23
through 32.