Weather
Observation, Measurement, and Map
Unit
Overview
Weather describes what is happening outdoors in a given place
at a given time. Weather is what happens from minute to minute. The weather can
change significantly within a very short time. For example, it may rain for an
hour and then become sunny and clear. Weather is something we hear about on the
television news every night. Weather includes daily changes in precipitation,
barometric pressure, temperature, and wind conditions in a given location.

A
Meteorologist's Toolbox for Observing and Gathering Weather Data
Meteorology is the science dealing with the atmosphere and its
phenomena, including weather and climate. Meteorologists use a variety
of tools to help them gather information about weather and climate. Some more
familiar ones are thermometers which measure air temperature, anemometers which
gauge wind speeds, and barometers which provide information on air pressure. These
instruments allow meteorologists to gather data about what is happening near
Earth's surface. Collecting data from other sources—and other parts of the
atmosphere—helps to create a more descriptive and accurate picture of weather.
The National Weather Service
(NWS) has several tools to monitor weather. A few of them are discussed in some
detail below.
Weather
Satellites

The primary observation systems
in the tropics are the Geostationary Operational Environmental Satellites
(GOES). These satellites, orbiting the earth at an altitude of about 22,000
miles above the equator, normally provide imagery every 30 minutes, both day
and night. With these images, forecasters can estimate the location, size,
movement, and intensity of a storm, as well as analyze its surrounding
environment.
Because they stay above a
fixed spot on the earth's surface, these satellites can continuously provide
data on a particular event. This helps forecasters monitor atmospheric
"triggers" for severe weather conditions such as tornadoes, flash
floods, hail storms, and hurricanes. The instruments on board the satellites
measure emitted and reflected radiation from which atmospheric temperature,
winds, moisture, and cloud cover can be derived.
Satellite images provide a
number of data products that are valuable during hurricane season, such as
● Basic day/night cloud imagery and low-level cloud and
fog imagery
● Observations of land surface temperature data (under
some conditions)
● Sea surface temperature data
● Winds from cloud motions at several levels
● Hourly cloud-top heights and amounts
● Rainfall estimates for flash flood warnings
For
additional information on Hurricanes, click on the following link: PDF
File
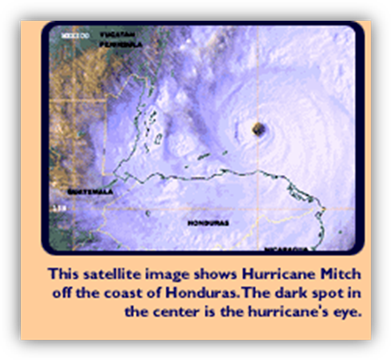
For viewing large weather
systems on a worldwide scale, weather satellites are invaluable. Satellites
show cloud formations, large weather events such as hurricanes, and other
global weather systems. With satellites, forecasters can see weather across the
whole globe: the oceans, continents, and poles. Recent satellite data is very
detailed, even to the point of showing states, counties, and even communities.
On each satellite there are
two types of sensors. One is a visible light sensor called the
"imager," which works like a camera in space and helps gather
information on cloud movements and patterns. This sensor can only be used
during daylight hours, since it works by capturing reflected light to create
images. Since different surface features reflect light in distinctive ways,
they can be distinguished from each other in the images. Water reflects very
little light, making it appear black on the satellite image. Land masses tend to
appear as shades of gray, depending on their temperature and moisture.
The second sensor is called
the "sounder." It's an infrared sensor that reads temperatures. The
higher the temperature of the object, the more energy it emits. This sensor
allows satellites to measure the amount of energy radiated by Earth's surface,
clouds, oceans, air masses and so on. Infrared sensors can be used at night—a
helpful feature for forecasters, considering that the “imager” can only pick up
data during daylight hours.
Doppler
Radar
Doppler radar is another essential meteorological tool. Radar works
a little differently from satellite sensors. Instead of reading reflected light
or energy, radar measures reflected sound waves.
When sound waves are broadcast
from a radar antenna, they may come into contact with objects in their path,
such as dust particles or ice crystals. If they come into contact with an
object that is moving away from the radar, the sound waves will be reflected
back at a decreased frequency (that is, fewer sound waves will be reflected
back within a certain measured time period). If the object they come in contact
with is moving toward the radar, the sound waves will be reflected back at an
increased frequency. This effect was discovered in 1842 by Christian Doppler.
Scientists have since learned to effectively apply Doppler's principle to
weather radar. Using Doppler radar, meteorologists can get a picture of
precipitation that allows them to track a storm's progress over time.
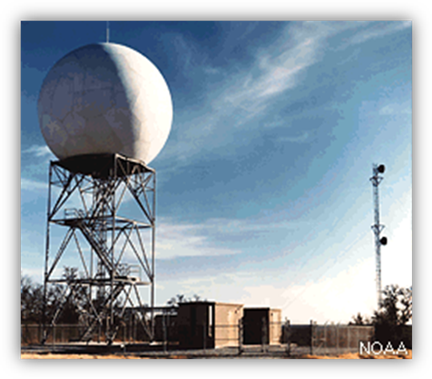
As part of its modernization
program, the National Weather Service (NWS) has installed Doppler weather radar
systems across the country, adding advanced new capabilities in warning for
severe weather. These radars provide detailed information on wind fields, rain
intensity, and storm movement. As a result, local NWS offices are able to
provide short-term warnings for floods, tornadoes, and high winds for
specific areas.
Doppler radars are so
sensitive they can detect and track clouds and even the presence of weather
fronts that have no precipitation or clouds. (Severe storms often form along
such invisible boundaries.) Because the radar scans at multiple elevation
angles, forecasters can "see" the full structure of a storm cell,
including storm tops and the presence of intense updrafts and downdrafts.
Sophisticated mathematical calculations give forecasters important information
derived from the radar data, such as estimates of rainfall amounts. A limitation
of these radars is that they cannot "see" farther than about 200
miles from the coast, and hurricane watches and warnings must be issued long
before the storm comes into range.
|
Reflectivity
Radial Wind Velocity |
|
|
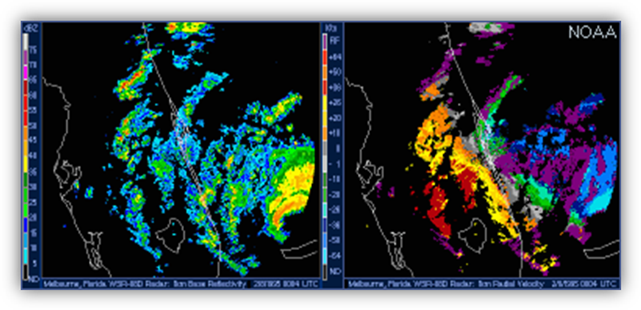
The images above show two
important radar products used by forecasters. The reflectivity images (above left)
are the ones frequently shown on TV. In these pictures, the forecaster can pick
out details about storm features (such as the locations of the eye and rain
bands), storm motion, and intensity. The radial wind velocity product (above
right) gives forecasters important information about wind speed and direction
that was not available with the older style radars. These tools allow
forecasters to provide much more timely and accurate warnings than were
possible only a few years ago.
A Meteorologist's Toolbox for Measuring Weather Data
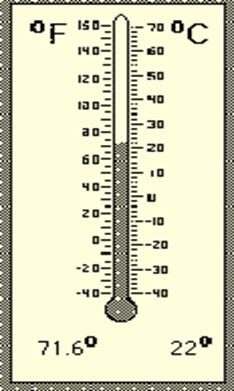
Thermometers
Thermometers measure air temperature. The units are either degrees
Fahrenheit or Celsius. Most Internet- based weather maps in the
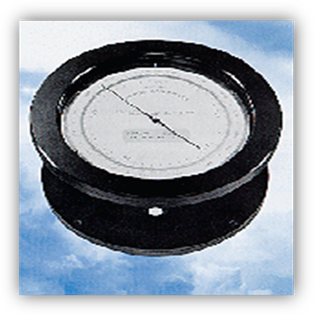
Barometers
A scale can measure your
weight. A barometer measures air weight by measuring air pressure. The units
can be inches or centimeters, but on Internet weather maps meteorologists use millibars (mb). Air pressure is
the weight of the atmosphere pressing down on the earth. When the weather is
calm the mercury in the barometer seldom moves more than half-an-inch below the
30-inch mark. If a high pressure system is on its way, often you can expect
cooler temperatures and clear skies. If a low pressure system is coming, then
look for warmer weather, storms and rain. Air pressure changes with
altitude. When you move to a higher place, say a tall mountain, air pressure
decreases because there are fewer air molecules as you move higher in the sky.
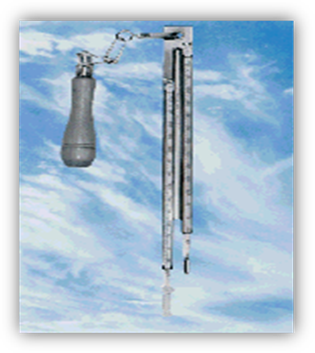
Psychrometer or Wet/Dry Bulb
Psychrometers measure how
much water is in the air (the relative humidity). They can also help
determine the temperature at which water condenses out of the air (the dew
point). Relative humidity is the amount of moisture the air can hold
before it rains. The most it can hold is 100 percent. Humidity is measured by a
psychrometer, which indicates the amount of water in
the air at any one temperature.
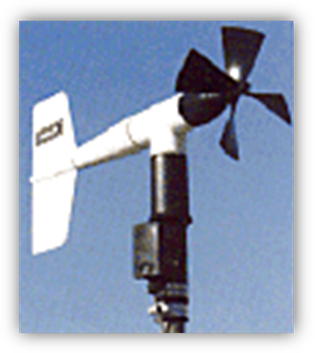
Weather
Vane
The direction of the wind is
measured with a wind vane. The speed is measured with an anemometer. A wind is
always named from the direction it is coming. A wind blowing from the north is
called a north wind.
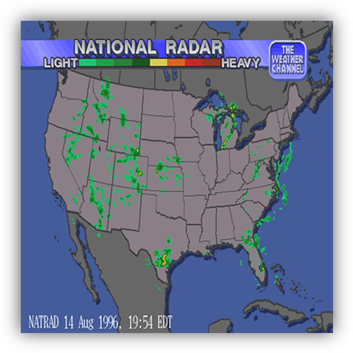
Precipitation
The position of rain, hail,
snow, etc. (precipitation) is measured with radar.
Clouds
The position of
clouds is photographed by satellites.
For additional
information on Weather Measurements,
Instruments, Definitions and Concepts, click on the following link: PDF File
WEATHER
SYMBOLS
Interpreting Surface
Observation Symbols
By means of high-speed
telecommunications, information from all over the world is sent to the National
Meteorological Center (NMC), in
As advances in computer
systems occur, data are becoming more complete and, hence, more accurate.
Meteorologists interpret and modify such prognostics according to their
knowledge of the prognostics' reliability and their familiarity with local
influences, such as topography and proximity to large bodies of water, in order
to derive the best possible weather forecasts.
Forecasts are disseminated by
television, radio, telephone, newspapers, and the Internet. Detailed forecasts
can usually be made only for a short future period (generally 48 hours or
less). Forecasts for up to five days can usually predict departures from normal
temperature and precipitation fairly well; longer-range predictions are more
general and less accurate, being based on the known normal weather of the area.
Mathematical models, particularly those run on supercomputers, have helped to
understand weather changes, including general global circulation patterns, and
how disturbances in the atmosphere and oceans affect the weather.
Symbols
and Definitions
|
H |
High Pressure
System: The air (barometric) pressure is high. Sunny, calm
days with little or no precipitation will follow. |
|
L |
Low Pressure
System: The
air (barometric) pressure is low. Expect precipitation and clouds. |
|
|
Cold
Front: Cooler (not necessarily cold) air is moving in to
meet warmer air. The cool air forces warm air up. If the warm air is humid
enough, precipitation will result. |
|
|
Warm Front: Warmer air is moving in
to meet cooler air. The warm air rises. Expect overcast skies, rain, or
storms. |
|
|
Stationary Front: A
warm air mass has met a cold air mass. Both are at a standstill. The front
(or boundary) sticks around for a while. Stationary fronts can bring several
days of cloudy, wet weather. They can last a week or more. Yuck! |


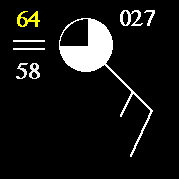
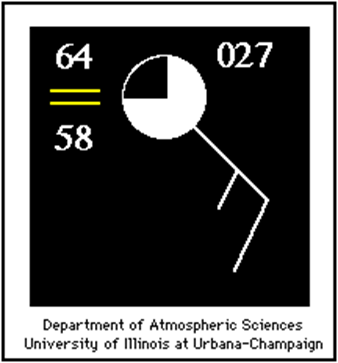
INTERPRETING SURFACE
OBSERVATION SYMBOLS
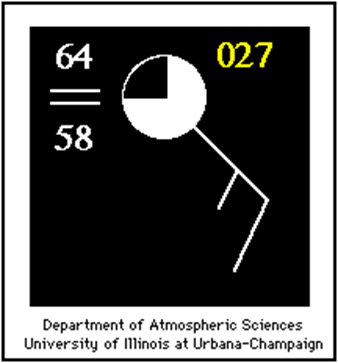
Observed
Temperature
(Station
reporting symbol)
The value highlighted in
yellow located in the upper left corner in the diagram above is the temperature
in degrees Fahrenheit. In this example, the reported temperature is 64
degrees. Temperature is defined as a measure of the average kinetic
energy (or speed) of the molecules in the air.
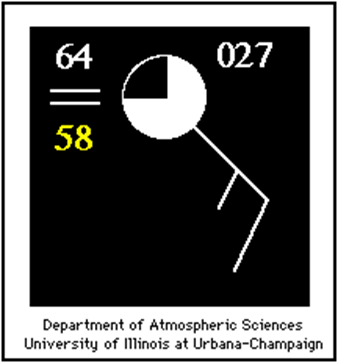
Observed
Weather
(Station reporting
symbol)
The symbol highlighted in
yellow (=) in the diagram below indicates the type of weather occurring at the
time the observation is taken. In this case, fog (=) was reported. If there
were thunderstorms occurring when the observation was taken, the symbol for
thunderstorms would have appeared instead.
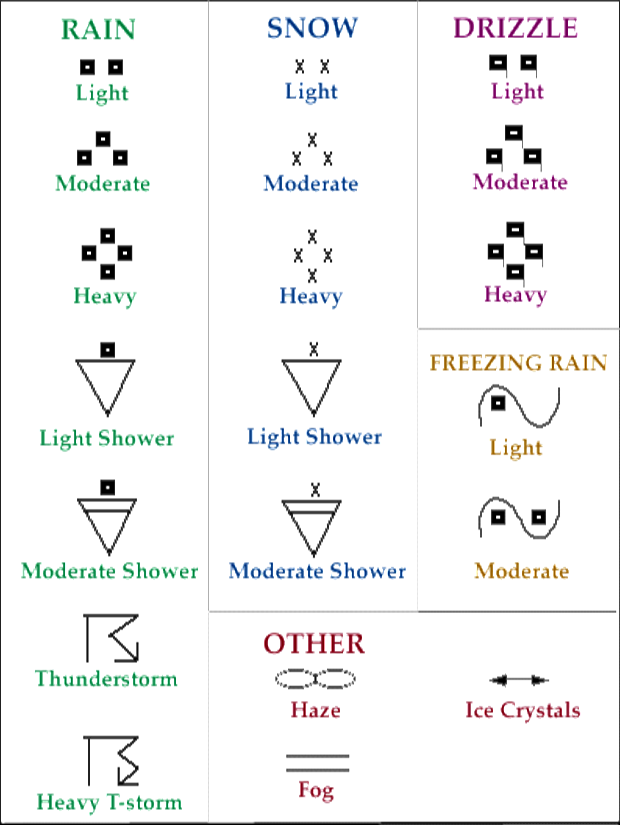
Common
Weather Symbols
The chart below identifies some
of the most commonly used weather symbols and the type of weather they
represent. For example, the first row of weather symbols (from left to right)
identifies Light Rain, Light Snow and Light Drizzle.
Observed
Dew Point Temperature
The value highlighted in
yellow located in the lower left corner in the diagram below is the dew
point temperature in degrees Fahrenheit. In this example, the reported dew
point temperature is 58 degrees.
Dew point indicates the amount of moisture in the air. The
higher the dew point, the higher the moisture content of the air at a given
temperature. Dew point temperature is defined as the temperature to
which the air would have to cool (at constant pressure and constant water vapor
content) to reach saturation. A state of saturation exists when the air is
holding the maximum amount of water vapor possible at the existing temperature
and pressure.
When the dew point
temperature and air temperature are equal, the air is said to be saturated.
Dew point temperature is NEVER GREATER than the air temperature. Therefore, if
the air cools, moisture must be removed from the air and this is accomplished
through condensation. This process results in the formation of tiny
water droplets that can lead to the development of fog, frost, clouds, or even
precipitation.
Relative Humidity can be inferred from dew point values. When air
temperature and dew point temperatures are very close, the air has a high
relative humidity. The opposite is true when there is a large difference
between air and dew point temperatures, which indicates air with lower relative
humidity. Locations with high relative humidity indicate that the air is nearly
saturated with moisture; clouds and precipitation are therefore quite possible.
Weather conditions at locations with high dew point temperatures (65 or
greater) are likely to be uncomfortably humid.
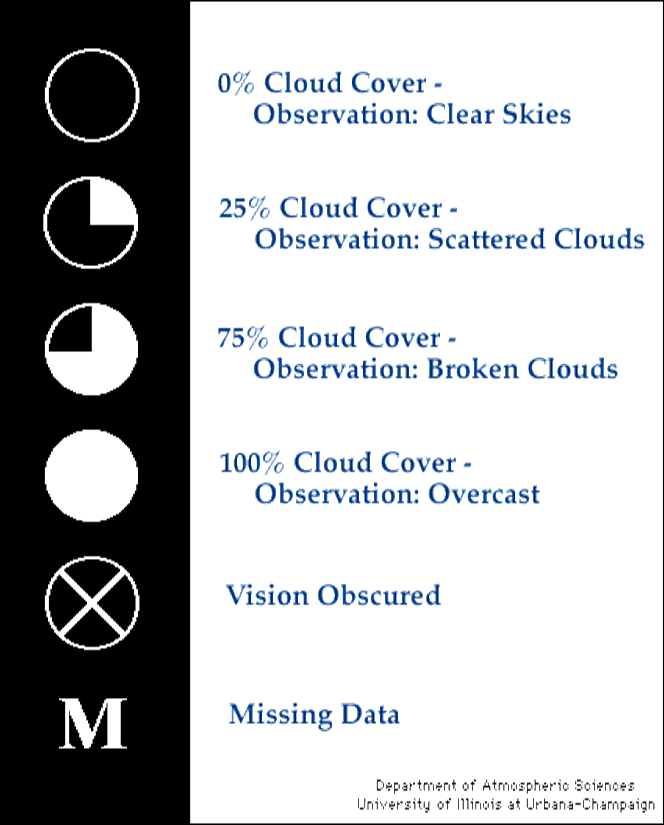
Observed
Cloud Cover
(Station reporting
symbol)
The symbol highlighted in
yellow indicates the amount of cloud cover observed at the time the observation
is taken. In this case, broken clouds were reported.
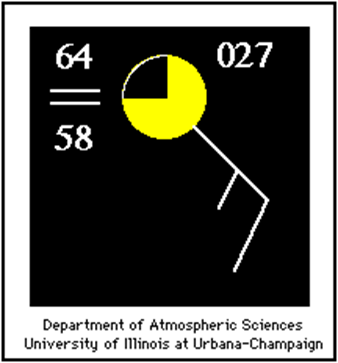
The chart below spans the
entire spectrum of cloud cover reports, from clear to overcast skies.
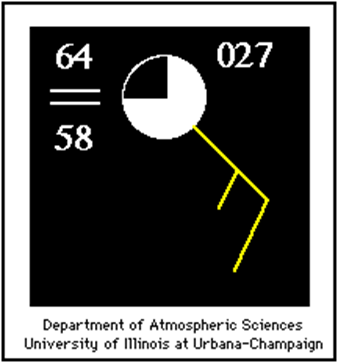
Observed
Sea Level Pressure
(Station reporting
symbol)
The value highlighted in
yellow located in the upper right corner (in the diagram below) represents the last
three digits of the observed pressure reading in millibars
(mb).
Observed
Winds
(Represented by wind barbs)
The symbol highlighted in
yellow (in the diagram above) is known as a "Wind Barb.” The wind
barb indicates the wind direction and wind speed.
Wind barbs point in the
direction "from" which the wind is blowing. In the case of the
diagram below, the orientation of the wind barb indicates winds from the
Northeast.
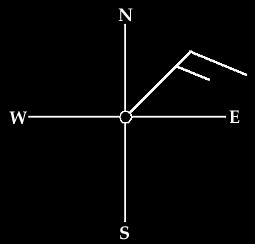
The term easterly means that
the winds are from the east. In the example above, the winds are out of the
northeast, or northeasterly. On the other hand, the term "eastward"
means the winds are blowing towards the east.
READING WEATHER MAPS
Temperature
Contours
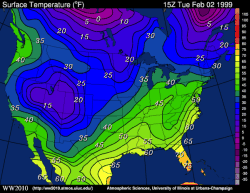
This surface meteorological chart
shows the temperature pattern in degrees Fahrenheit over the continental United
Sates and is updated every hour.
Surface temperatures reported
at each station are contoured every five degrees Fahrenheit. Areas of warm and
hot temperatures are depicted by orange and red colors and cold temperatures
(below freezing) are shaded blue and purple. Areas of sharp temperature
gradients, several contours close to each other, tend to be associated with the
position of surface fronts. Fronts separate air masses of different
temperature and moisture, and, therefore, density characteristics.
In the example above on the
left, there is a large change in temperature from western
Pressure
and Temperature
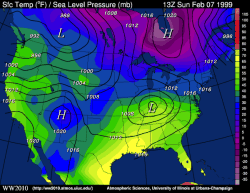
This map
depicts temperature and sea-level pressure contours. It is useful for finding fronts and high and low pressure systems.
The solid black contours represent pressure contours (isobars) in millibars. The isobars have a contour interval of
four millibars. The wind speed is directly related to
the distance between the isobars. The closer the isobars are together, the
stronger the pressure gradient, and the
stronger the wind.
The colored
regions represent the surface temperature. The contour interval of the
isotherms is 5 degrees Fahrenheit. From the chart above you can sometimes find warm and cold
fronts. Fronts are usually located where temperature changes
drastically over a short distance.
When pressure contours are
perpendicular to isotherms it means it is either getting warmer or colder. By
knowing that winds flow counter-clockwise around a low and clockwise
around a high, one can usually see whether there is warming or cooling going
on. Usually when the winds are from the south, and you have isotherms
(temperature lines) perpendicular to the isobars (pressure lines) you have warm
air advection (warm air moving up from the south). The opposite is true
if you have winds from the north and isotherms perpendicular to isobars.
In that case you have cold
air advection (cold air coming in from
the north) going on.
Dew
Point Reports and Contours
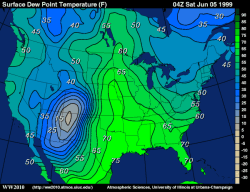
This surface
meteorological chart shows the dew point temperature pattern
(in degrees Fahrenheit) over the continental
When the dew
point temperature is close to the temperature of the air, the air is nearly
saturated. However, nearly saturated air is not always humid. Only when the
temperatures reach above 70 degrees Fahrenheit and dew points rise nearly as
high does the air feel "muggy" and uncomfortable. Humidity of
the air generally increases southward, similarly to the temperatures. During
the summer, dark green shading (dew points in the 60s or higher) indicates
humid air. Dew points in the 40s or lower (light green, yellow or white) are
considered dry. In winter, dew points average 30-40 degrees lower, similarly to
the temperatures (except the southern coastal regions where the fluctuations
are a little smaller).
In the map
above on the left, there is a large change in dew point temperature from
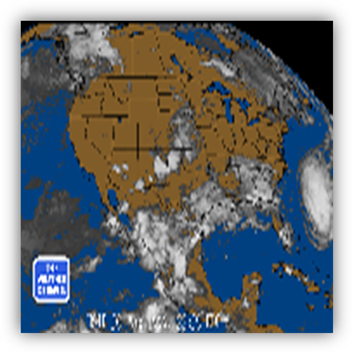
Pressure
and Infrared Satellite
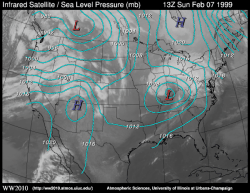
This map
depicts sea-level pressure across the
In the
background, infrared satellite data shows the cloud patterns over